


Sample Financial Analysis Report
I. Overview
Beijing SinoHytec Co., Ltd. (referred to as “SinoHytec”) is a frontrunner in China’s fuel cell system market, focusing on the research, production, and commercialization of hydrogen fuel cell systems. With the global demand for clean energy increasing and strong support from the Chinese government for the hydrogen energy industry, SinoHytec has benefitted from favourable policy support. However, as the industry is still in its early expansion stage, the company is under significant financial pressure due to its heavy R&D spending and market expansion investments.
This report provides an in-depth analysis of SinoHytec’s key performance indicators (KPIs) from 2020 to 2023, comparing its position with both Chinese and global competitors, and assessing operating performance and risks to inform investors.
II. Key Financial Indicators and Trend Analysis
1. KPI Data Table and Visualization
The following table lists SinoHytec’s KPIs from 2020 to 2023, along with trend analysis:
| KPI | 2020 | 2021 | 2022 | 2023 |
|---|---|---|---|---|
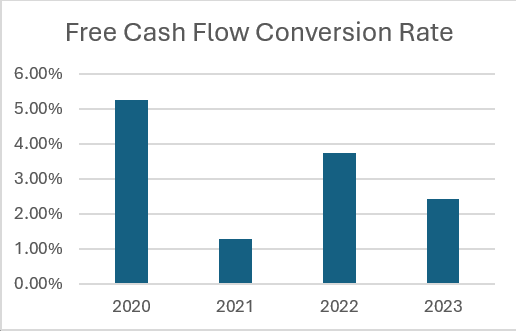
| Free Cash Flow Conversion Rate | 5.27% | 1.29% | 3.74% | 2.43% |
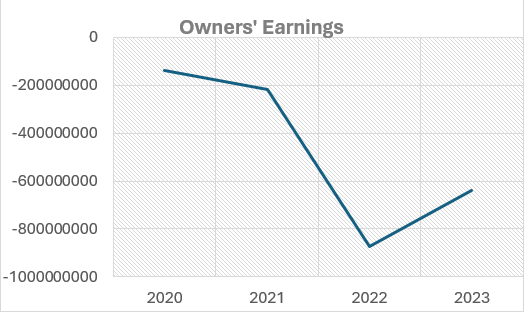
| Owner’s Earnings | -139M CNY | -215M CNY | -873M CNY | -639M CNY |
| EBITDA Margin | -2.29% | -33.40% | -23.15% | -29.06% |
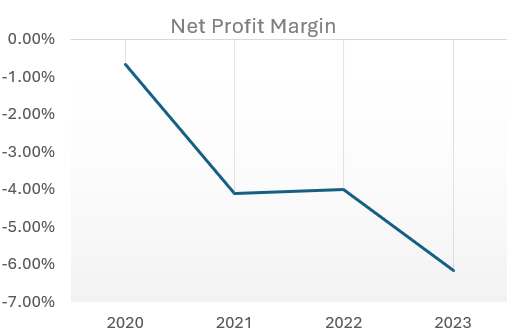
| Net Profit Margin | -0.67% | -4.12% | -3.99% | -6.15% |
| Gross Profit Margin | 43.66% | 37.88% | 38.40% | 32.53% |
| Return on Equity (ROE) | -1.43% | -8.03% | -8.31% | -9.86% |
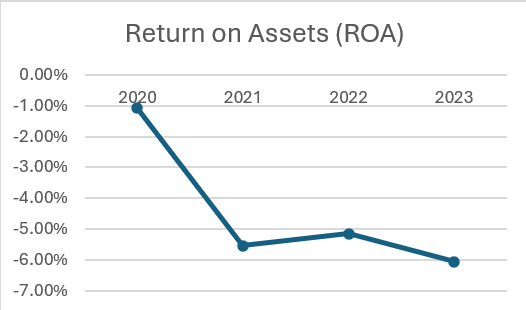
| Return on Assets (ROA) | -1.07% | -5.54% | -5.15% | -6.07% |
| Operating Profit Margin | -95.24% | -77.53% | -51.38% | -39.55% |
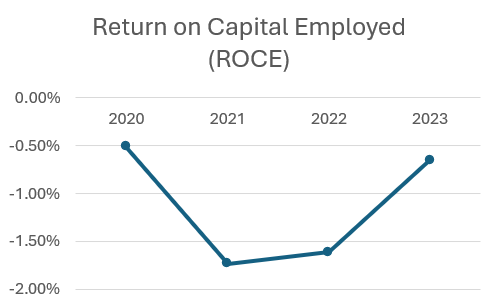
| Return on Capital Employed (ROCE) | -0.51% | -1.73% | -1.61% | -0.65% |
| Pre-tax Profit Margin | -2.28% | -8.41% | -6.44% | -2.96% |
| EBT Margin | -7.40% | -38.43% | -32.02% | -39.91% |
| Free Cash Flow Margin | -29.98% | -41.17% | -98.60% | -91.13% |
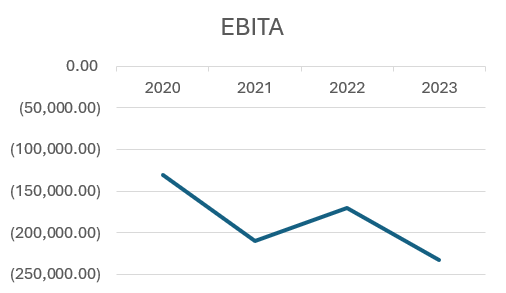
| EBITA | -13.08M CNY | -2.10B CNY | -1.71B CNY | -2.33B CNY |
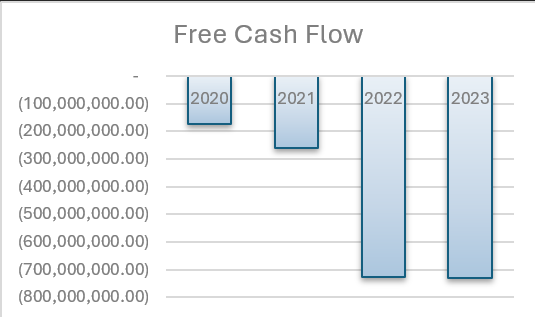
| Free Cash Flow | -172M CNY | -259M CNY | -728M CNY | -730M CNY |
(The above table shows the KPI change trend in different years, and the specific charts are shown in the attachment below)
III. Detailed Financial Performance Analysis
1. Profitability Analysis
- Owner’s Earnings: SinoHytec has consistently reported losses, with owner’s earnings widening from approximately -139 million CNY in 2020 to -873 million CNY in 2022, before slightly improving to -639 million CNY in 2023. These losses are attributed to high R&D expenses and market expansion investments, indicating challenges in restructuring the business model and improving profitability.
- EBITDA Margin: The EBITDA margin has worsened over time, from -2.29% in 2020 to -29.06% in 2023, reflecting increased operating costs and expenses despite growing revenue. The sharp drop in 2021 to -33.4% highlights the cost burden of scaling up in an emerging industry
- Net Profit Margin: The net profit margin has gradually decreased to -6.15% by 2023, indicating that the company has not yet reached a stable profit-generating stage and continues to face cost management challenges.
2. Gross Profit Margin and Cost Control
- Gross Profit Margin: Gross profit margin has declined from 43.66% in 2020 to 32.53% in 2023. This drop is largely due to rising raw material costs and competitive pressure, which have increased production costs. The company’s additional R&D spending aimed at maintaining technological leadership also impacted its gross profit margin.
3. Return on Capital Analysis
- ROE: ROE has steadily declined, from -1.43% in 2020 to – 9.86% in 2023, reflecting inefficiencies in utilizing shareholder equity to generate returns.
- ROA: Similarly, ROA has fallen from -1.07% in 2020 to -6.07% in 2023, suggesting underutilization of assets and a need for better asset management.
- ROCE: ROCE has remained negative throughout the analysis period, from -0.51% in 2020 to -0.65% in 2023. This indicates a need for improved capital efficiency.
4. Cash Flow Performance
- Free Cash Flow & Conversion Rate: SinoHytec’s free cash flow has consistently been negative, expanding from -172 million CNY in 2020 to -730 million CNY in 2023. The free cash flow conversion rate recovered slightly to 2.43% in 2023, but the ongoing negative cash flow highlights liquidity challenges that may require external financing.
- Free Cash Flow Margin: The free cash flow margin has dropped from -29.98% in 2020 to -91.13% in 2023, underscoring the company’s struggle to generate cash flow to support its expansion.
IV. Analysis of Chinese and Global Competitors’ Operations and Risks
1. Comparison with Chinese Market Competitors
In China, SinoHytec’s main competitors include Weichai Power, SAIC Group, and Hydrogenics. These companies have established a strong market presence with greater resources and mature supply chain management. Weichai Power, for instance, has integrated capabilities in the hydrogen fuel cell value chain, benefiting from lower production costs and stable profit margins, while SinoHytec’s market share and brand recognition remain relatively lower.
2. Comparison with Global Market Competitors
On a global scale, SinoHytec faces competition from companies like Plug Power in the United States and Ballard Power Systems in Canada. These firms have longstanding R&D experience and product advantages, allowing them to establish strong business foundations in Europe, North America, and beyond.
- Operational Comparison: Global competitors have an advantage in terms of production scale, international market presence, and cost efficiency. Plug Power, for example, has built partnerships with automakers and energy companies, securing a
stable market share in the hydrogen fuel cell automotive and industrial sectors. Ballard Power’s high-efficiency fuel cell systems are widely used in public transportation and logistics, giving it a solid competitive edge. - Profitability: Both Plug Power and Ballard Power report EBITDA and net profit margins that are superior to SinoHytec’s, as their larger production scale and established business models enable them to achieve stable profits. In contrast, SinoHytec’s high R&D costs and extended expansion timeline continue to impact its profitability.
3. Operating Risk Analysis
- Policy Dependency Risk: The global hydrogen industry relies on policy support to drive growth, and any changes in policy could significantly impact revenue. SinoHytec is particularly dependent on Chinese policy incentives, while competitors like Plug Power and Ballard Power mitigate risk through diversified international markets.
- Market Competition Pressure: The fuel cell market is becoming increasingly competitive, with low barriers to entry intensifying the competition. SinoHytec faces competitive pressure from both domestic and international companies and must invest more in product innovation and market expansion to protect its market share.
- Capital and Cash Flow Pressure: SinoHytec’s cash flow remains constrained, while companies like Plug Power and Ballard Power benefit from mature capital structures, offering greater flexibility in managing capital needs. SinoHytec may need to rely on additional financing to support its growth and R&D investments.
V. Conclusion and Investment Recommendations
1. Overall Assessment
SinoHytec’s financial performance from 2020 to 2023 reflects substantial investments in R&D and rapid expansion in the hydrogen fuel cell market. Although the company has potential for growth, global competitors have stronger financial resources, production scale, and brand recognition. SinoHytec’s reliance on Chinese policy support also introduces significant operational risk, while international competitors benefit from diversified markets, enhancing their resilience.
2. Investment Recommendations
- Short-Term: For short-term investors, SinoHytec’s current financial position, including its lack of profitability and cash flow challenges, indicates a high- risk profile. It is recommended to wait for signs of improvement in profitability and cost management before investing..
- Long-Term: For long-term investors with higher risk tolerance, SinoHytec’s position in the hydrogen fuel cell industry presents potential for growth, especially as global demand for clean energy expands. Investors are advised to monitor the company’s progress in improving brand recognition, cost control, and supply chain efficiency, and particularly in its international expansion, as opportunities to consider gradual investment.
Appendix: KPI Trend Charts (2020–2023)
1.Free Cash Flow Conversion Rate
2. Owner’s Earnings
3. EBITDA Margin

4. Net Profit Margin
5. Gross Profit Margin

6. Return on Equity (ROE)

7. Return on Assets (ROA)
8. Operating Profit Margin

9. Return on Capital Employed (ROCE)

10. Pre-Tax Profit Margin
11. EBT Margin

12. Free Cash Flow Margin

13. EBITA
14. Free Cash Flow
(The above specific charts show the KPI change trend in different years)
This report provides a financial analysis and investment recommendation for Beijing SinoHytec Co., Ltd. for the years 2020-2023.
This analysis report is issued by www.lexitatum.com, a website owned and operated by AI ChopsticksPig Dynamic Limited.
Call: 852-2359 9330